Monthly Consumption
Overview
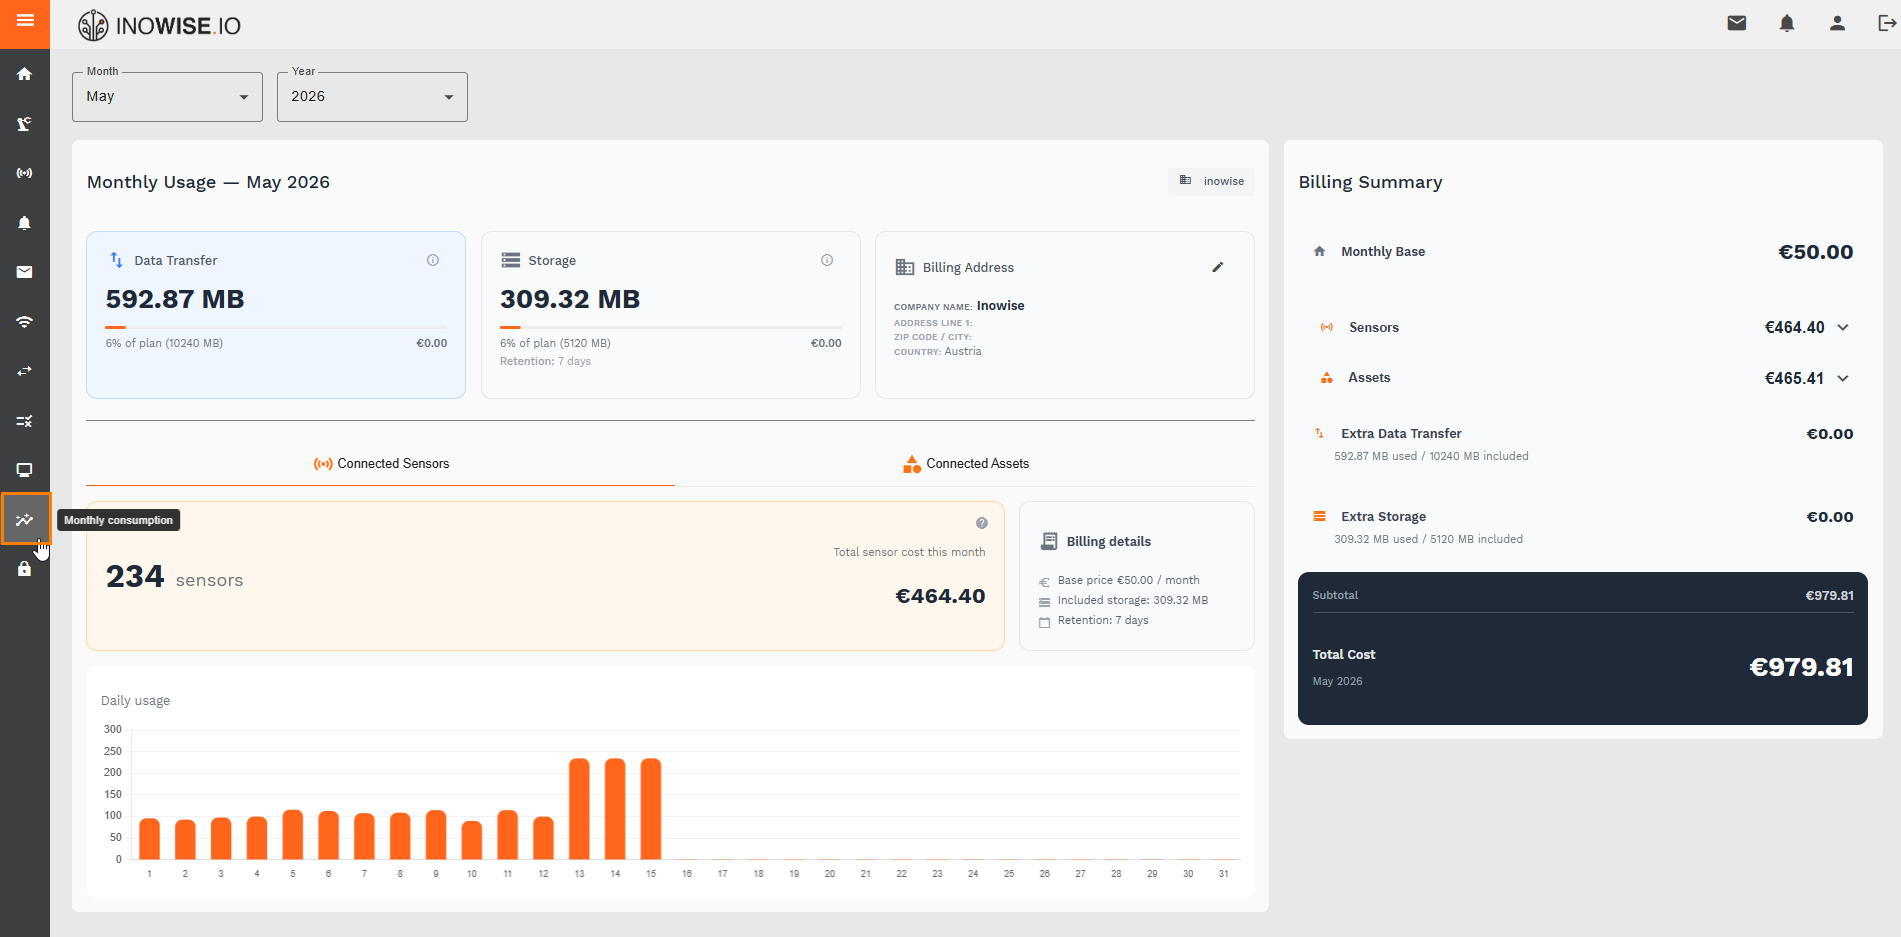
The Monthly Consumption module gives you a full overview of your platform usage and associated costs for the current billing period. It combines resource consumption metrics with a live billing summary so you always know exactly what you are using and what it costs.
Usage Overview
The top section displays your current resource consumption against your plan limits:
| Metric | Description |
|---|---|
| Data Transfer | Total data volume transmitted by your devices this month, shown as a percentage of your plan allowance |
| Storage | Total data stored on the platform this month, including the configured retention period |
| Billing Address | The company billing details associated with your account |
Connected Sensors & Assets
Two tabs provide a breakdown of billable resources:
Connected Sensors — displays the total number of active sensors and their cumulative cost for the current month, along with a daily usage chart showing sensor activity across each day of the billing period.
Connected Assets — displays the total number of active assets and their associated costs for the current month.
Billing Summary
The billing summary panel on the right provides a full cost breakdown for the current month:
| Line Item | Description |
|---|---|
| Monthly Base | Fixed base subscription fee |
| Sensors | Variable cost based on the number of connected sensors |
| Assets | Variable cost based on the number of connected assets |
| Extra Data Transfer | Overage charges if data transfer exceeds the plan allowance |
| Extra Storage | Overage charges if storage exceeds the plan allowance |
| Subtotal | Sum of all line items before tax |
| VAT | Applicable tax calculated on the subtotal |
| Total Cost | Final amount due for the billing period |
Daily Usage Chart
The bar chart at the bottom of the module shows day-by-day sensor activity throughout the month, allowing you to identify peak usage days and understand consumption patterns over time.
What You Can Do in Monthly Consumption
- Monitor resource usage against your plan limits in real time
- Review itemised billing broken down by sensors, assets, and overages
- Track daily consumption patterns via the usage chart
- Verify billing address and update company details if needed
- Anticipate monthly costs before the billing period closes